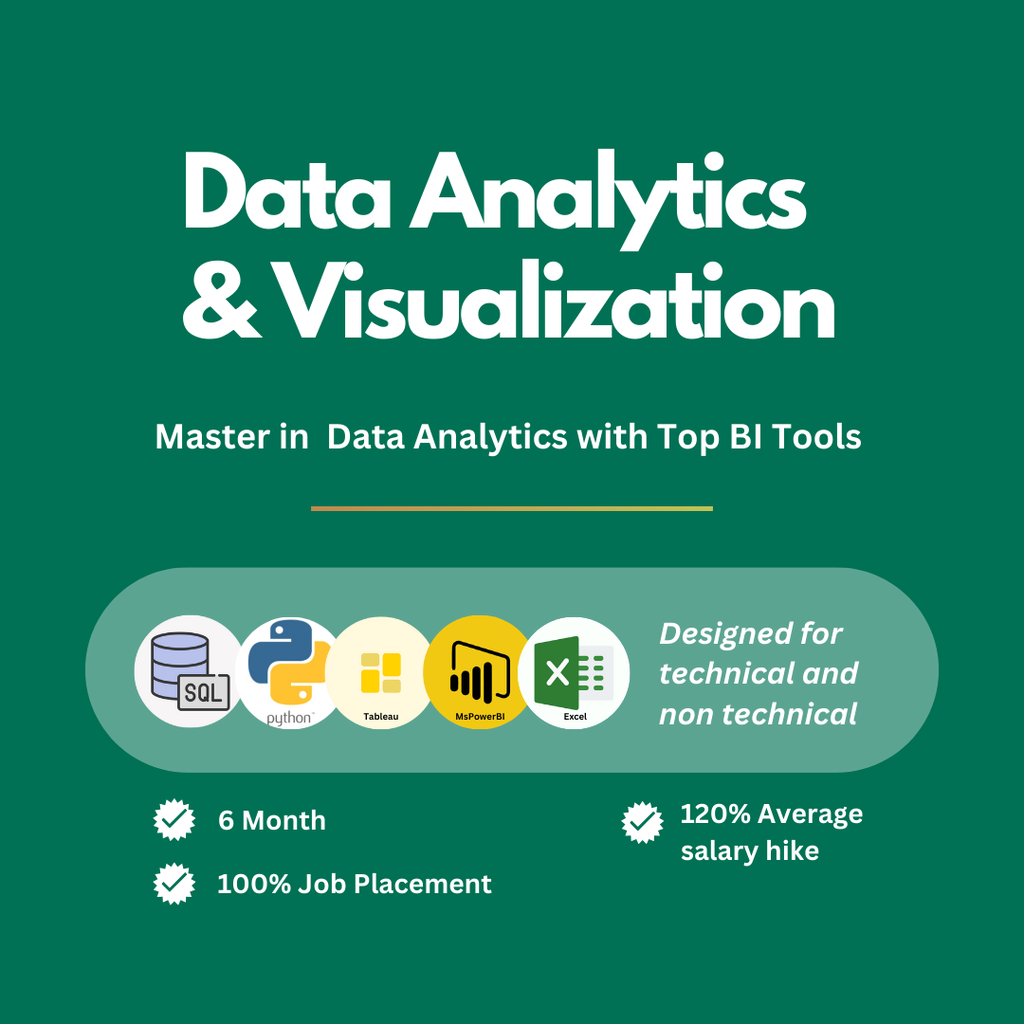
Data Analytics & Visualization
Course Duration: 6 Months
Technology you will learn
PYTHON
SQL
TABLEAU
MS POWER BI
EXCEL
What you will gain?
Completion Certificate
Real World Project Based Learning
1:1 Hand-on Training
24/7 Online Course Access
Project Portfolio
Mock Interviews
Placement Assurance

Course Key Feature
-
Provides comprehensive training in Python for data manipulation, SQL for database querying, and Excel for data analysis, ensuring a solid foundation in data analytics
-
Teaches advanced data visualization skills using industry-leading tools
-
Hands-on experience through real-world projects that simulate data analytics challenges faced in various industries
-
Guides the creation of interactive dashboards and reports to visualize trends, patterns, and KPIs effectively

Job Roles
- Data Analyst
- Business Analyst
- Data Scientist (Entry-Level)
- Data Visualization Specialist
- BI (Business Intelligence) Developer
- Marketing Analyst
- Operations Analyst
- Data Engineer (Junior Level)
-
Market Research Analyst
Explore Other Trending Courses
Learn Job ready skills courses with hands-on training
Your Dynamic Snippet will be displayed here... This message is displayed because you did not provided both a filter and a template to use.
